(3 minutes)
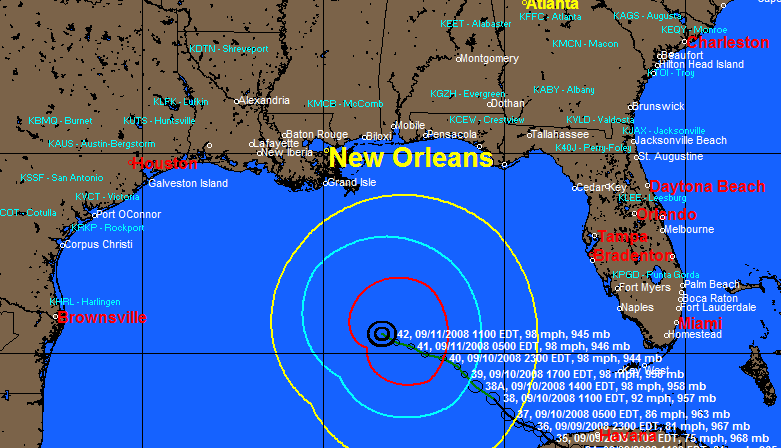
In the 2009 version, the user has the option to select the color used to plot a location on a tracking chart. The color can be controlled by location, group, or individual location... thus enabling the user to "highlight" critical locations on a map. The following is an example of using multiple location plot font sizes and colors.
CLICK
HERE TO VIEW A VIDEO DEMONSTRATION OF THE LOCATION PLOT FONT CONTROL
(3 minutes)