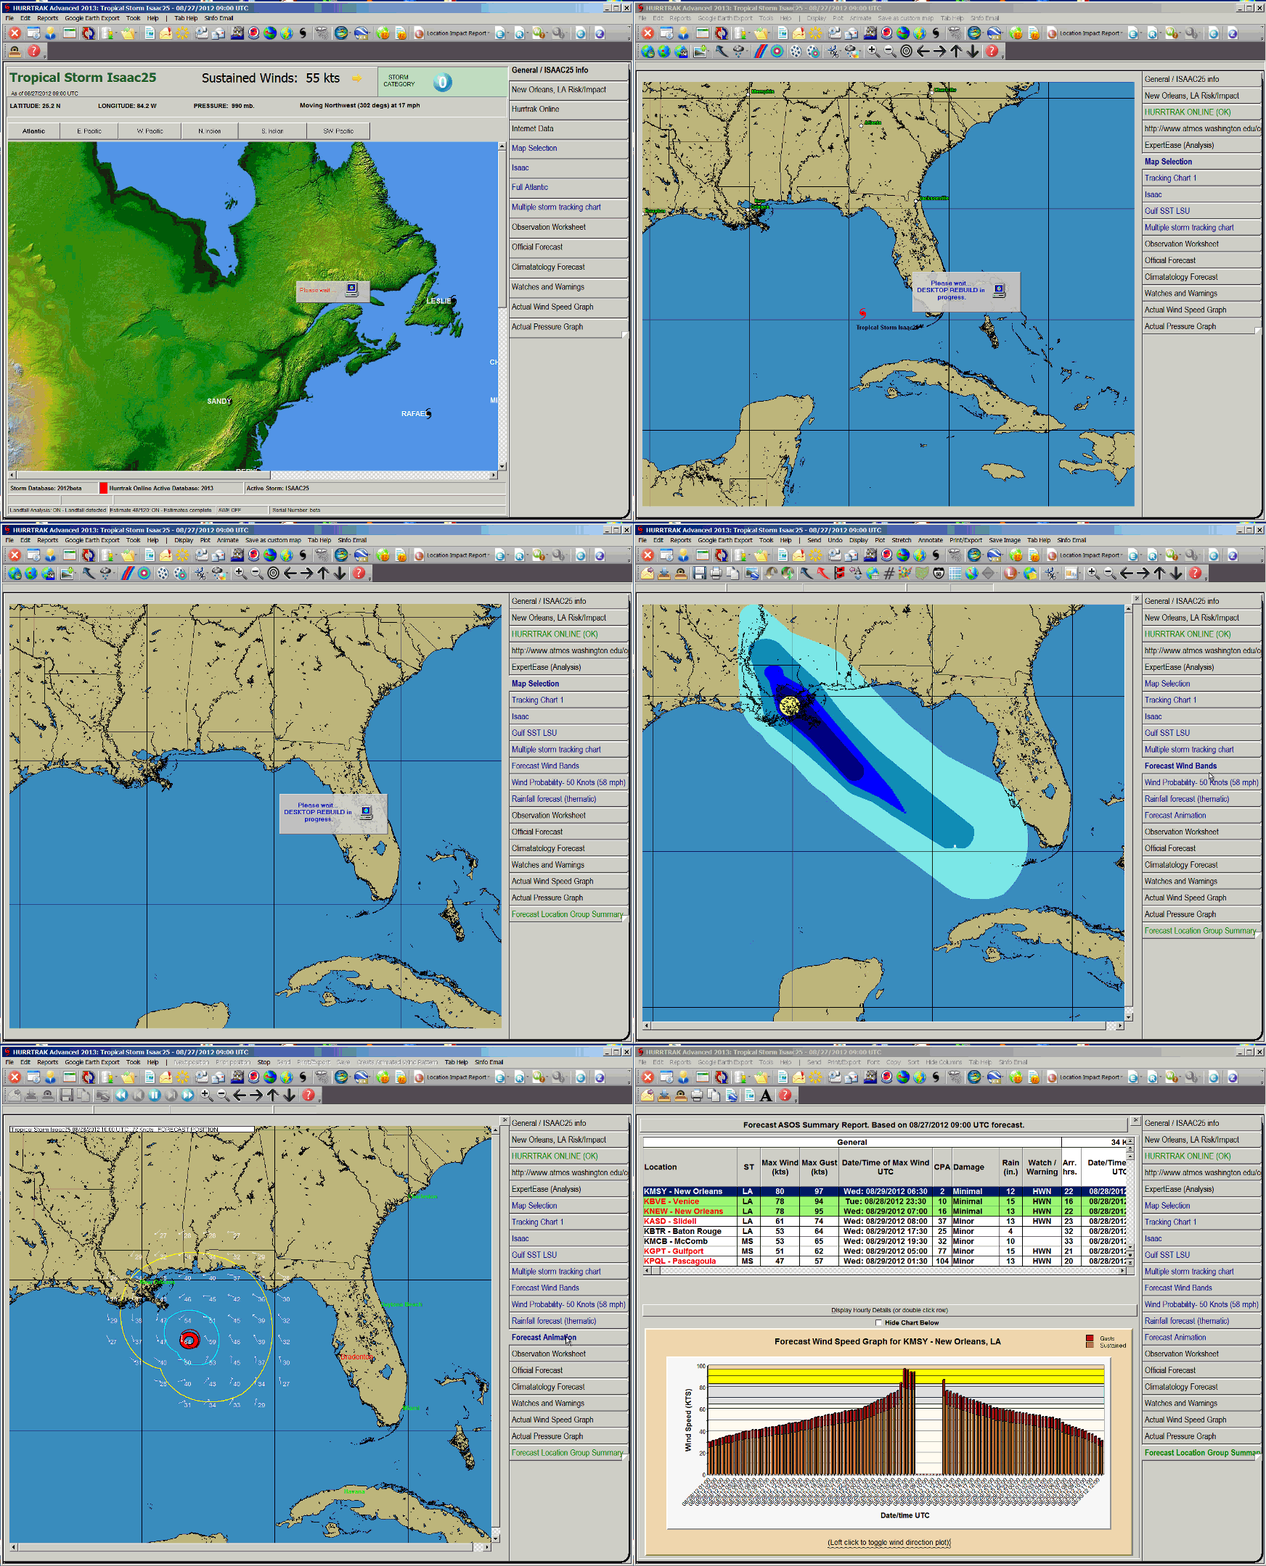
This change represents a major enhancement to the user “experience” in 2013. The Hurrtrak system will now “remember” the graphics, reports and animations created/viewed for a storm, and recreate them automatically when reloading or when storm data is updated. This will routinely and significantly reduce time (and key/mouse strokes) spent re-creating graphics and reports that you typically generate for a storm. Items automatically rebuilt include ALL of the tracking charts and the options displayed on them. Other items rebuilt include:
Wind Band
Analysis
Location Impact Reports
Animations
County and ZIP Based Impact Reports
Wind Probability Analysis
Wind Probability Reports
Surge Probability Analysis
Rainfall Analysis and Thematic Charts

Watch the short video below for more
information
(Best viewed by selecting HD and Full Screen in YouTube)