
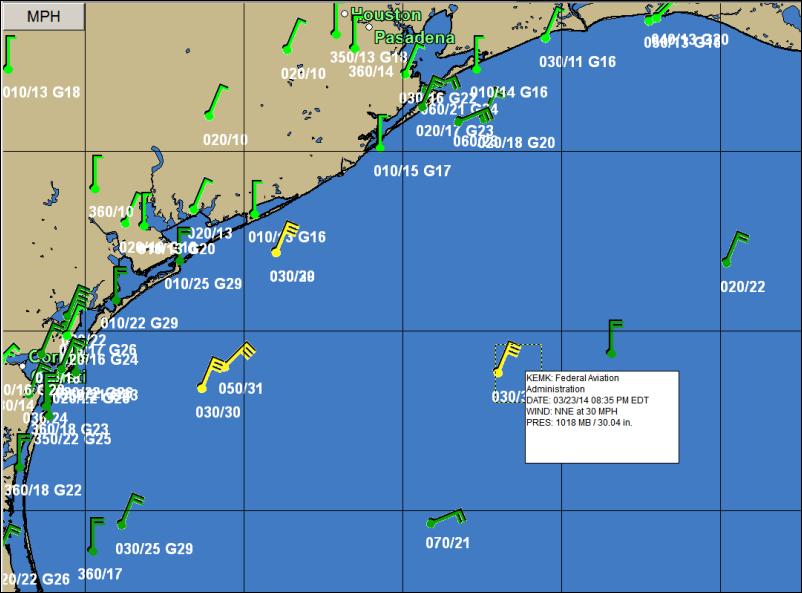
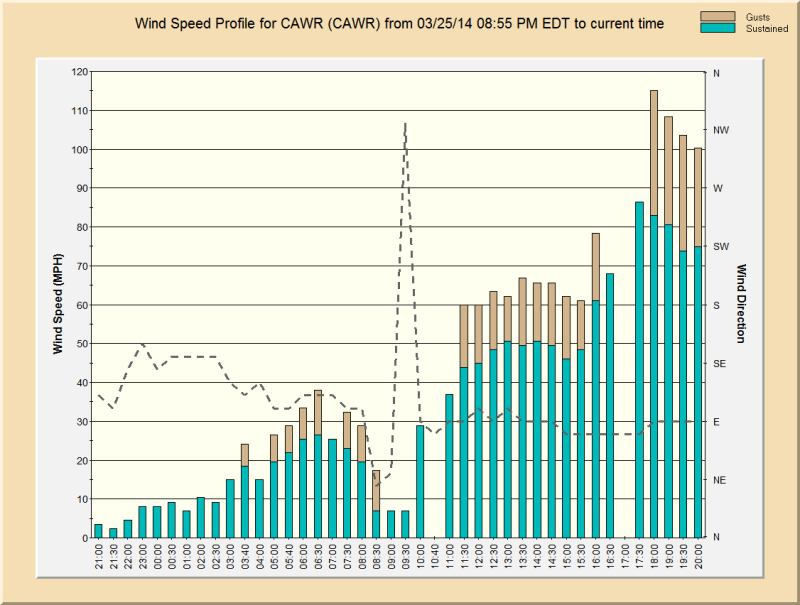
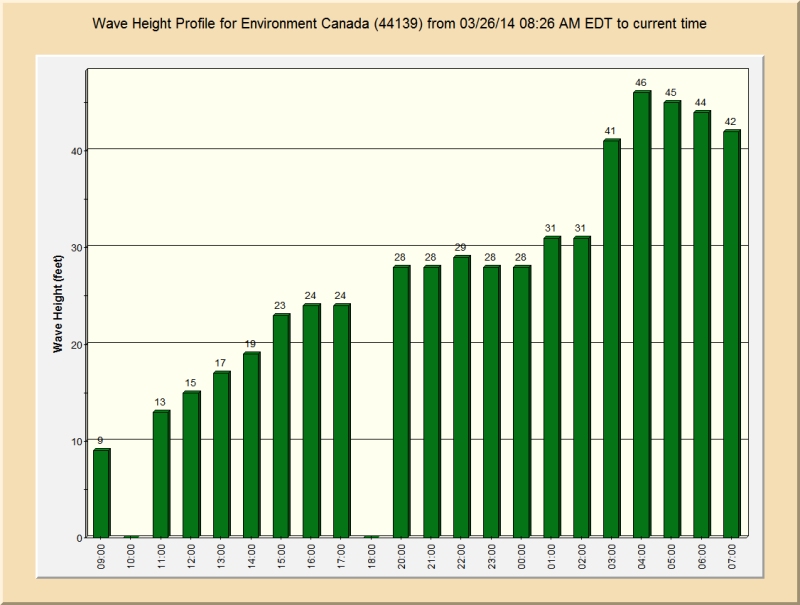
A significant 2014 enhancement is the ability of users to examine current observations for all official weather stations, NOAA operated coastal stations, Buoys, Oil Rigs, Ship Reports and observed storm reports (over 5000 stations). Data includes Wind Speeds, Wave Heights, Pressure, Ocean Temperatures, Air Temperature, Dew Points and Local Storm Reports. This is presented in a user friendly format including the depiction of current tropical cyclones / formation alert areas and the ability to plot graphically or produce reports on the parameters listed above. Sample uses of this feature include:
•
Comparison of forecast vs
actual developing conditions
• Easy, quick displays
of smaller scale events away
from the storm’s circulation
(i.e. feeder bands)
•
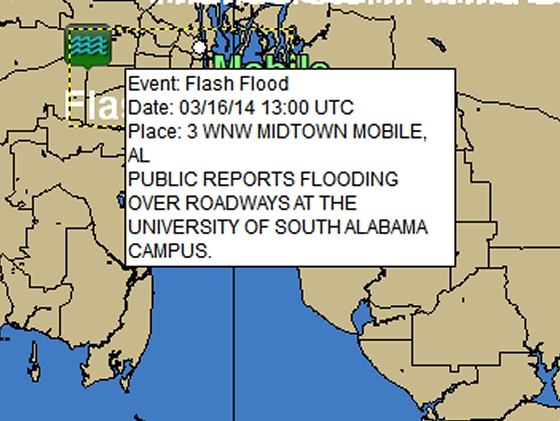
Real time, multiple source
on-site reports, indicating
storm effects on the ground
• The ability to view
local (or worldwide) weather
observations, even without
active tropical storms
•
Depiction of formation
"alert" areas.
Watch the video below for more
information
Best viewed by selecting HD in the video settings (gear icon lower right)
and watching in Full Screen.
(The direct YouTube link is
https://www.youtube.com/watch?v=6YM2x0fnurE&hd=1)
Click on thumbnail images below for some additional sample screenshots (or scroll down the page)

![]()

Click here for sample Observation Report in PDF format
