SLOSH Inundation Analysis
SLOSHVIEW, a module that is part of HURRTRAK RM/Pro and HURRTRAK Advanced gives the user great flexibility in viewing the SLOSH Storm Surge data.
In addition to displaying the "raw" SLOSH values, the system also has the ability to calculate and graphically display an inundation analysis... which is the potential water level above ground (AGL). The elevation database used is the 30 Meter USGS National Elevation Database (NED) while the SLOSH data is supplied by NOAA.
All of this is done on user selectable maps that can be zoomed down to the street level. The mapping database includes landmarks such as cities, railroads, airports, pipelines, power lines... and more.
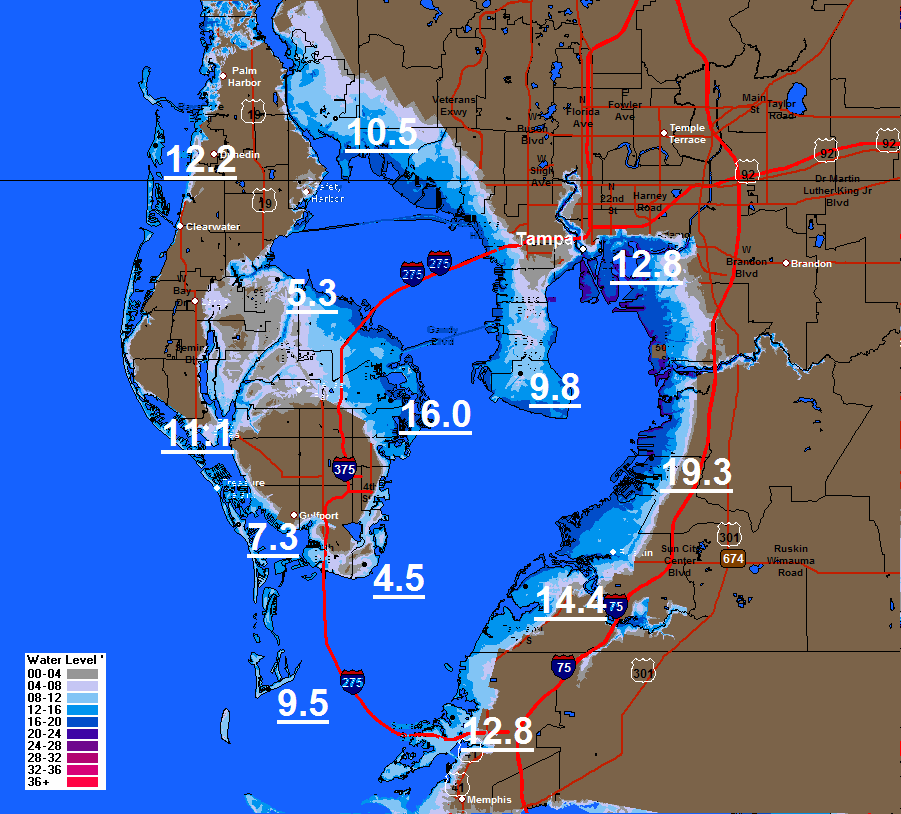
When using the SLOSHVIEW program, the user can select the area or SLOSH basin they would like to analyze. A larger scale map will show general storm surge flooding... in this case a Cat. 4 storm impacting the Tampa, FL area.
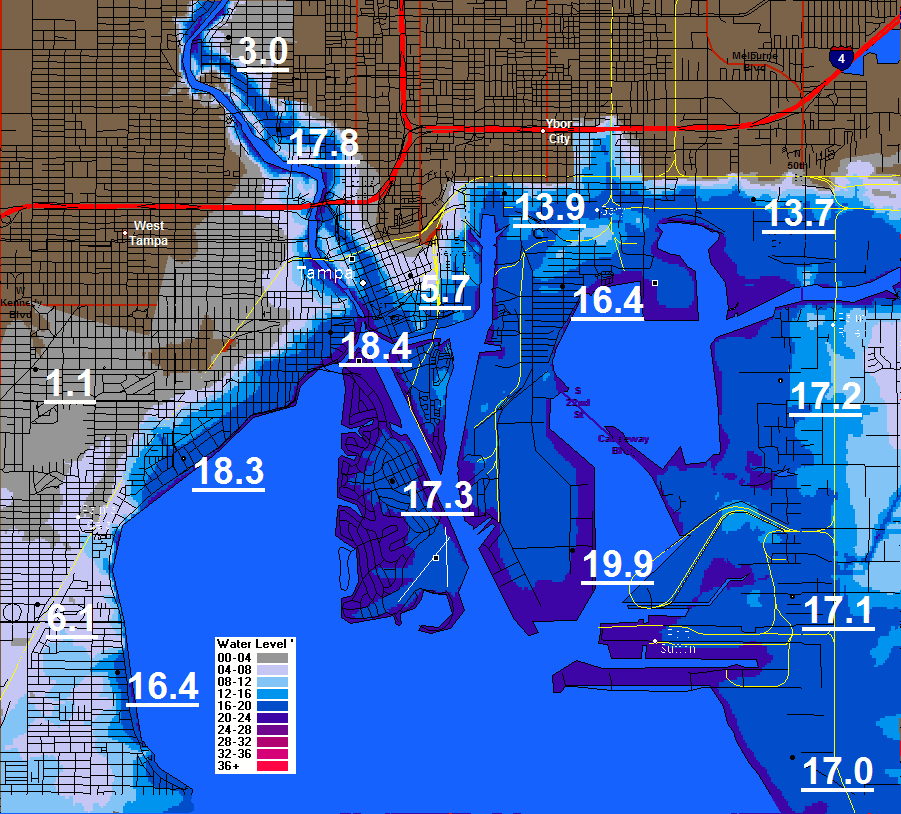
Zooming down further into Tampa provides a more detailed analysis
Obviously a certain amount of care must be taken when zooming down to very small (street level) maps. The SLOSH analysis and USGS data is not exact enough to narrow flooding areas down to individual streets.
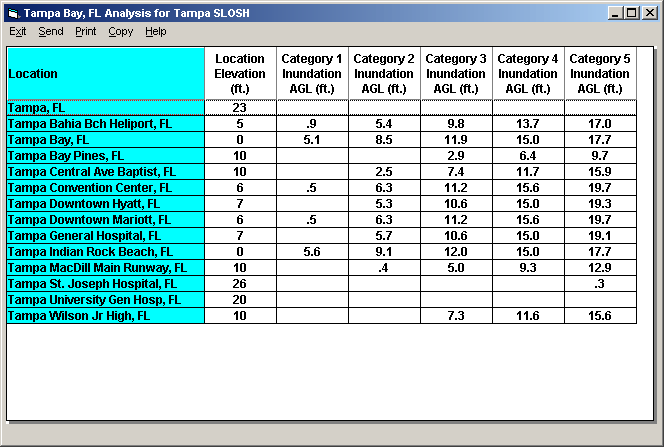
Finally, the user has the ability to create SLOSH Inundation Location reports which show the maximum flooding for each category of storm.
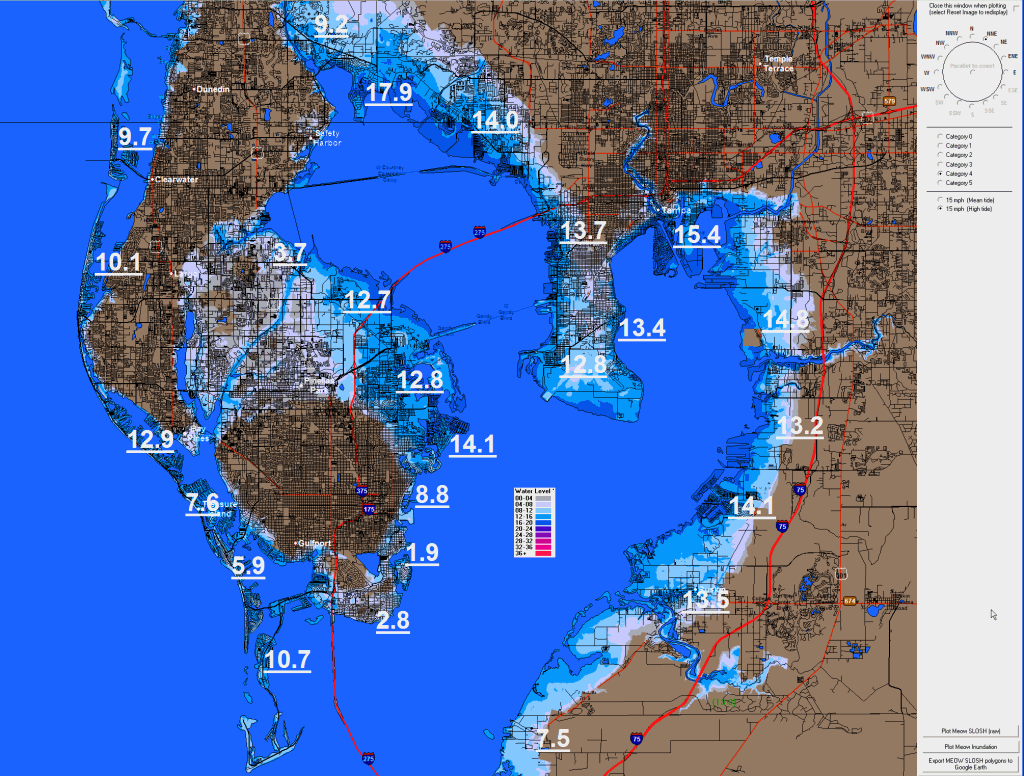
Hurrtrak Advanced users have the ability to display the detailed SLOSH MEOW data! The MEOW data is more specific than the MOM data in that it can display potential storm surge flooding based on a storms strength and direction of motion.
CLICK HERE TO VIEW A VIDEO DEMONSTRATION OF THE HURRTRAK ADVANCED SLOSH CAPABILITIES
(4 minutes)
*****************************************Screen Images
The sample image below shows the potential affects of a Cat. 4 storm impacting Tampa from the SSW.
The incorporation of this detailed, more storm specific data, to the system will allows users to not only do long term planning but also make operational decisions based on a current storm's strength and motion.
The combination of the detailed mapping database, the USGS elevation data and the NWS SLOSH information makes this a powerful SLOSH analysis tool.