|
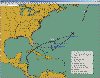
"True" Pan and Zoom Interface.
We now offer "true" Pan
and Zoom capabilities. Now, after “building” an image with several tracking
selections…you can zoom in, zoom out, or move the map. Regardless, all
of your tracking selections remain! |
 |
"Expert Ease"
–
On a daily basis, our chief meteorologist
will discuss, via video update, current tropical
conditions as
well as what is likely to occur in the near term. His observations are
integrated within the Hurrtrak program throughout the Atlantic Hurricane
season. |
 |
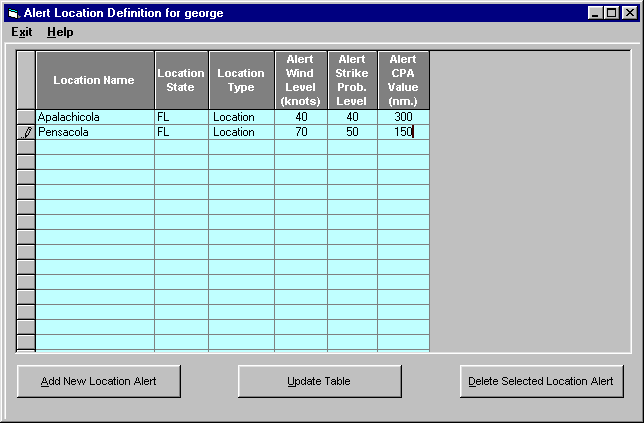
"Enhanced Hurricane Watches and Warnings"
–
The National Weather Service
/ Hurricane Center is improving the depiction of
wind watches and warnings...
and adding in 2018,
accurate Storm
Surge watches and warnings.
 |
 |
"Potential Tropical Cyclones"
–
This year the National
Weather Service (NWS) will have the option to issue advisories and watches &
warnings for disturbances that are not yet tropical cyclones, but which pose
the threat of bringing tropical storm or hurricane conditions to land areas
within 48 hours.
|
 |
"Enhanced Storm Surge Probabilities"
– Severe Weather Watch & Warning Alerting allows the user to quickly
receive notifications when severe weather threatens any set of locations.
Alerts are delivered via email or shown on the "desktop".
|
 |
"Observed Storm Report"
– A new
report that list the local storm reports for a specified time period and
area. As with all Hurrtrak reports... this report can easily be shared
with others via email.
|
 |
"Warnings Report"
– A new
report that list the active tornado and thunderstorm warnings for a
specified area. As with all Hurrtrak reports... this report can easily
be shared with others via email.
|
 |
"Severe Weather Alerting System"
– Severe Weather Watch & Warning Alerting allows the user to quickly
receive notifications when severe weather threatens any set of locations.
Alerts are delivered via email or shown on the "desktop". |
 |
"Storm Report Notification and
Alerting"
– This feature alerts users when a storm is reported (on the ground).
Alerts can be configured for any location or set of locations and delivered
on the "desktop" or via email. |
 |
"Observed Weather Notifications"
– Similar to the 2 items above, this feature will send out alerts
when any official weather station observes a severe weather conditions.
i.e. heavy thunderstorm, hail, damaging wind reports. Again... alerts
are sent out via Email or shown on the desktop. |
 |
"Point and Click GFS forecast
and report"
– Within the observation module you can now show forecast generated
by the US Model (GFS) in both textual and digital form. In addition, a
summary report can be generated for a set of locations giving the user a
quick view of forecasted conditions for sites they monitor. |
 |
"Forecast Wind
Trend"
– Forecast wind trend indicates the change in a
location’s forecast wind
from the prior forecast
advisory and is extremely
helpful in quantifying the
effect of a newly released
forecast from the National
Hurricane Center (or JTWC).
This information will be
included on all location
impact type reports as well
as the risk analysis
function and the narrative
impact statement. |
 |
"Desktop Rebuild"
– The Hurrtrak system will “remember” the graphics, reports and
animations created/viewed for a storm, and recreate them automatically when
reloading or when storm data is updated. Items automatically rebuilt
include ALL of the tracking charts and the options displayed on them. |
 |
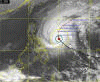
"Current Weather/Depiction"
– Examine current observations for all official weather stations,
NOAA operated coastal stations, Buoys, Oil Rigs, Ship Reports and observed
storm reports (over 5000 stations). Data includes Wind Speeds, Wave Heights,
Pressure, Ocean Temperatures, Air Temperature, Dew Points and Local Storm
Reports.
|
 |
"Watches/Warnings"
– The system is now able to determine whether individual locations
are included within NHC/NWS issued hurricane and tropical storm watches and
warnings. This is displayed graphically and also included on all location
based reports. These include the EZ-report, Location Wind Profile, County
Wind Profile, Zip Code Wind Profile, Executive and Risk-Impact reports. .
|
 |
EZ Map –
Enables
both new and seasoned users to be more productive immediately. Press a
button, and the system generates a tracking map for a current storm with all
of the most common plot options. Choose from a default to user specific options.
|
 |
EZ Report –
Designed
for new users, but useful for everyone. Simply supply a valid US address
(street address, city-state, zip code) and the system generates an
informative report for that single location. Just click on the "EZ"
button, supply an address and you have your report...
Boom!
|
 |
Data
Layering -
The ability to easily view/hide different data layers. |
 |
More Maps! -
We have added a few more topo/relief type maps to the system.
|
 |
Simplified Google
Earth Selection and Output -
With just one click , you can create a collection
of Google Earth output and bundle them into one file.... and, you can either
save it as a file, save it to the EMail Outbox for later EMailing.
EMail it immediately or initiate a Google Earth session. In addition,
Google Earth files can now be automatically generated an Emailed when new
data arrives on a current storm. |
 |
Redesigned EMail
Alerts - In 2011 we have simplified the creation and execution of EMail
Alerts. We have
also added a new EMail Alert type called a Location Group Alert.
|
 |
Revamped Automatic
Summary Reports - We have also simplified the definition and execution
of Automatic Summary Reports.
In addition, we have added a new Automatic report... Risk/Impact
report..
|
 |
New Automation -
In 2011 we have
added a whole new category of Automation outputs.. they include,
Tracking Maps, Google Earth KML/KMZ, EXCEL and Shape File output.
These output files can either be saved as a file and/or emailed.
|
 |
Enhanced Usability -
A recent "facelift" provides greater use of command and toolbars as well as
ease in selection of maps and satellite images. |
 |
Multiple EMail
Attachments - For
anyone who emails information from the Hurrtrak system.. and who doesn't...
this is a welcome time saving addition which allows the user to send
multiple application outputs in a single email. |
 |
Interactive Wind
Speed Forecast - Just
“point & click” on a tracking map and display forecast wind speeds for
desired location. |
 |
Risk/Impact Tab-
New tab displays the Risk/Impact information,
along with a wind speed/ direction graph for all your base locations.
|
 |
Risk/Impact Reporting -
New report displays the Risk/Impact
information, along with a wind speed/ direction graph for
any set of locations.
|
 |
Application "Skins" -
Personalize your system's
look and feel by using different application color and font schemes or
"skins" with the Hurrtrak Application. Enhanced in 2011. |
 |
Tray Alert Messaging -
We found that Hurrtrak users busy at
their workstations desired a way to be alerted to new and changing
conditions in the tropics. No problem! In 2009 we are introducing a "tray
alert messaging" (TAM) system. TAM notifies our users, via pop-up tray
messages, of several noteworthy conditions including: the formation of new
storms, storm strengthening or weakening, the issuance of watches or
warnings, updated storm data, issuance of the last advisory, new tropical
weather outlooks or new tropical disturbance statements. |
 |
Native Google Earth support.
In addition to the graphics interface below, this function export KML
(Google Earth's native language) that represents a significant number of a
storm's observed and forecast parameters.
|
 |
Expanded Google Earth Information.
In addition to the LARGE
amount of hurricane information that the user is able to export from the
HURRTRAK system, you can also
superimpose National Weather Service information on the same
Google Earth “image”. |
 |
Storm Surge Probabilities -
The
Hurrtrak system has the ability to display…both graphically and through
reports, storm surge probabilities for 2' - 25’. This combined with enhanced
SLOSH information, provides users with the most detailed storm surge
information available. |
 |
Narrative Impact Statements -
In addition to the summary and detailed
impact reports, in 2009 we have added the ability to show a "computer AI
generated" narrative description of the impact to a location. This can be
viewed for the base location, any location in a summary impact report and/or
in the auto generated summary report. Both standard and "executive" formats
are available. |
 |
"True" Pan and Zoom mapping in
SloshView -
2009
brings Pan & Zoom capabilities to the Slosh display program. This allows the
user to select a different map region to analyze without having to "reset"
the map and redefine the storm surge parameters. |
 |
Location plot font control -
In the
2009 version, users have the option to select the font type, color,
and size used to plot a location on a tracking chart. The color can
be controlled by location groups or individual location... thus enabling the
user to "highlight" critical locations on a map. |
 |
Tropical Disturbance Statements -
Tropical
disturbance statements will now be part of the Hurrtrak Online data stream
and displayed in the Hurrtrak system.
|
 |
Multiple "undo" levels -
Enhancements to the user
interface now include the ability to undo multiple plotting layers.
|
 |
Average
Forecast Error Enhancements -
We have added the ability to plot the 72 and/or 120 hour forecast average
error. |
 |
Forecast Model Selection Enhancements -
Users can
now be more selective of which forecast models to plot. (Selection is by
type and time period.)
|
 |
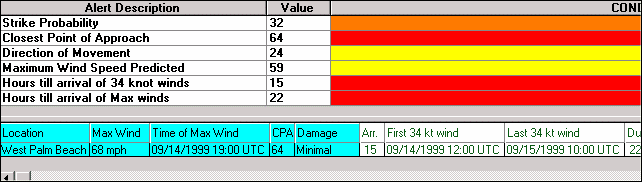
Enhanced Risk Alert -
Both wind
probability and wind probability trend have been added to the risk
alert table. |
 |
Integration with
Google Earth. This function provides
the ability to export just about all of the system graphics and display them
on Google Earth. |
 |
Summary Report Google Earth Export with live web
cams
With the summary report
export, you have the ability to view a "live" web cam image of the
location being analyzed! The system is pre-loaded with about 100 web cams
links. Alternatively, you may choose to override these locations and define
your own live or static images!
|
 |
Expanded Historical Storm Databases.
The system has
all storm databases from 1851 to 2021. They are accessible from the main
tracking program (i.e. not just the History module).
The wind radii data is estimated for storms from 1851-1980 |
 |
Damage Comments.
The summary impact report which details
expected wind speeds for locations has a damage comment column which
describes the likely damage using either the Saffir-Simpson scale or a
modified Texas Tech University scale.
|
 |
Wind Pattern graphic which shows the wind field pattern around the
storm. |
 |
Animated
Wind Pattern graphic. Same idea as above but now it can be
animated. |
 |
Support of
National Hurricane Center Wind
Probabilities |
 |
Multi-colored wind arrows showing the storm's
wind vectors. |
 |
Forecast Eye diameter control. This
improves the accuracy of all wind impact calculations
|
 |
Non-Location based Summary reports.
These reports have been expanded to allow for storm only based reports.
|
 |
Custom Summary reports. User's can
define the sections of the report they would like to include/exclude.
|
 |
Chart Note display
improvements. Chart notes can be displayed manually using drag and
drop. (links show short video of this function)
|
 |
Outlook Email
enhancement whereby the user can save the Hurrtrak initiated email to the
drafts folder (to be sent) instead of sending directly from HURRTRAK. |
 |
National Mosaic Radar can now be used as a
background tracking map
|
 |
Integration with
Microsoft's EXCEL system. This function provides the ability to export all reports and tables to EXCEL in
order to do further analysis.
|
 |
Significant
advancements in wind estimation techniques by analyzing a storm's position
every 30 minutes instead of once an hour. |
 |
Forecast rainfall
has been added to the base impact report (on main tab) as well as the
alerts, summary and location and county forecast impact report . |
|

|
Depiction of eye
and eye wall during animation sequence. |
|

|
Enhanced SLOSH
report that allows a user to create a report for any location group |
|

|
Enhanced eye wall
depiction allowing several varieties of eye wall transparency |
|

|
Spell Checker in
English or Spanish. Never send another email to your boss with
spelling error |
|

|
Desktop Satellite
(tm) function that will keep a current satellite image on your Windows
Desktop |
|

|
Forecast Model
display program that shows all of the current forecast model tracks, even
when there are no named tropical systems. |
|

|
Cross Wind Analysis
shows the cross wind component of sustained winds and gusts across
runways. |
|

|
Average error ONLY forecast track.
|
|

|
Highly detailed Pan and Zoom maps
which allow user to go down to the street level |
 |
Twenty Six Highly
Detailed Fixed Tracking Charts, now also in 1400x1048
|
 |
The ability to create fixed custom
tracking charts |
 |
Ability to show counties and
roadways on all tracking charts (US) |
 |
Satellite Image Map
Tracking. This allows the user to access satellite images as the
tracking map background. |
 |
Radar Image Map
Tracking. This allows the user to access NWS radar images as the
tracking map background.
|
 |
Sea Surface
Temperature Image Map Tracking. This allows the user to utilize a
choice of SST images as the tracking map background. |
 |
Landsat Image Tracking Charts. This allows
the user to view the storm track on fixed Landsat satellite images.
Provides a great way to see what land type usage is being impacted. |
 |
Topographical Tracking Charts. This allows the
user to view the storm track on topographical type maps. Useful in
determining what kind of terrain a storm is encountering or forecast to pass
over. |
 |
Display NHC forecast path
or NHC forecast path with average error on
any chart |
 |
Support of National Hurricane Center's 96 and 120 hour forecast
including estimation of storm's wind fields at those extended forecast
hours..
|
 |
Color Coded Storm Tracks. Not a big deal
but now you can have the storm track be color coded by storm strength.
Color are user definable. |
 |
Animate the storms past and
forecasted motion |
|
|
Accurate graphical representation of the storm's eye, destructive eyewall, 34, 50 and 64 knot winds and wind
field. |
 |
Sophisticated, climatology
based forecast |
|

|
Display hurricane forecast model
tracks on any tracking chart |
 |
Display "Chart Notes"
indicating the storm's observed data |
 |
Display the areas of hurricane and tropical
storm watches and warnings |
 |
Display the storms past and forecast wind band analysis.
Now with up to 10 levels. |
 |
Ability to display multiple
storm tracks |
|

|
Display National Weather Service
forecast precipitation information on any tracking chart or county
thematic map |
|

|
Display maximum forecast wind and
precipitation forecast on county based thematic type maps
|
 |
Plot the forecast or actual
flood index on a tracking chart |
 |
Display internally calculated Strike
Probabilities |
 |
Enhanced Tracking
Chart Annotation Capabilities |
 |
Extensive
reporting capabilities
 |
|
|
Ability to send graphics,
reports and text via EMAIL |
 |
Integration with
Microsoft Outlook Email system. Hurrtrak
sends all email via Outlook. No longer does the user have to maintain 2
address books
|
|
|
Ability to save
and/or send Animation files as animated GIFS.
Now send your favorite storm sequence via email. |
 |
Ability to save
and/or send any report or graphic as a Adobe Acrobat
PDF file. Acrobat has become the standard in the sharing of
documents and reports You can send reports without being concerned
about it's formatting. |
 |
Ability to export report
data to HTML |
 |
Ability to export report
data to a comma delimited file |
 |
Enhanced Windows printing
capabilities |
 |
Copy (to clipboard)
capability for ALL reports and storm data
|
 |
Ability to send Alert
EMail notices (Completely revamped in 2011) |
 |
Automatically generate summary
reports upon receipt of new data (Completely
redesigned in 2011)
|
|
|
Automatically create & update
your "favorite" reports. |
|
|
Includes a separate historical
analysis program |
 |
QuickPlot feature that allows the user to get a quick, complete snapshot of the
current tropical storm situation.
|
 |
H*Wind Display Program. We have created a new
program that provides an interactive method of viewing/analyzing the AOML/HRD
data. |
 |
Slosh Storm Surge MOM Data
|
|

|
Graphically display hurricane reconnaissance
reports utilizing highly detailed pan and zoom maps. Now with
HIRES support. |
 |
Decision Support Capabilities which allow
the user to define key action or decision points for a location.
These action points are then displayed in location impact reports and also used to
depict "decision arcs"
|
|

|
New "risk
alert" feature that allows the user to get a quick visual analysis of
the the risk to their location. |
 |
"What If
Capabilities" (Direct to Point) |
 |
Maintain a "User
Diary" |
 |
Advisory
"ticker" |
 |
Vast location database |
 |
Enhanced font options
and control |
 |
Extensive user
customization capabilities
|
 |
Graphical based custom map
creation |
 |
Ability to customize the
tracking chart colors |
 |
Estimate the
"missing" NHC forecast wind field information
|
 |
Landfall Analysis
|
 |
Enhanced
integration with HURRTRAK ONLINE |
 |
Analyze and Graph the flood index for any location, county or zip code
|
 |
Conduct post storm analyses. |
 |
Display the storms 3D surface
wind graph for any past or forecast time |
 |
Status bars on main
screen |
|
|
The complete
1991 - 2021 storm database which includes
all observations, forecast and advisory text |
|
|
Status bars on
tracking chart display |
 |
Extensive astronomical tide
database for over 20,000 US coastal sites |